A structured data analysis of 21 seasons of Formula 1 racing — examining car superiority, reliability, qualifying pace, pit strategy, and circuit DNA to answer one central question.
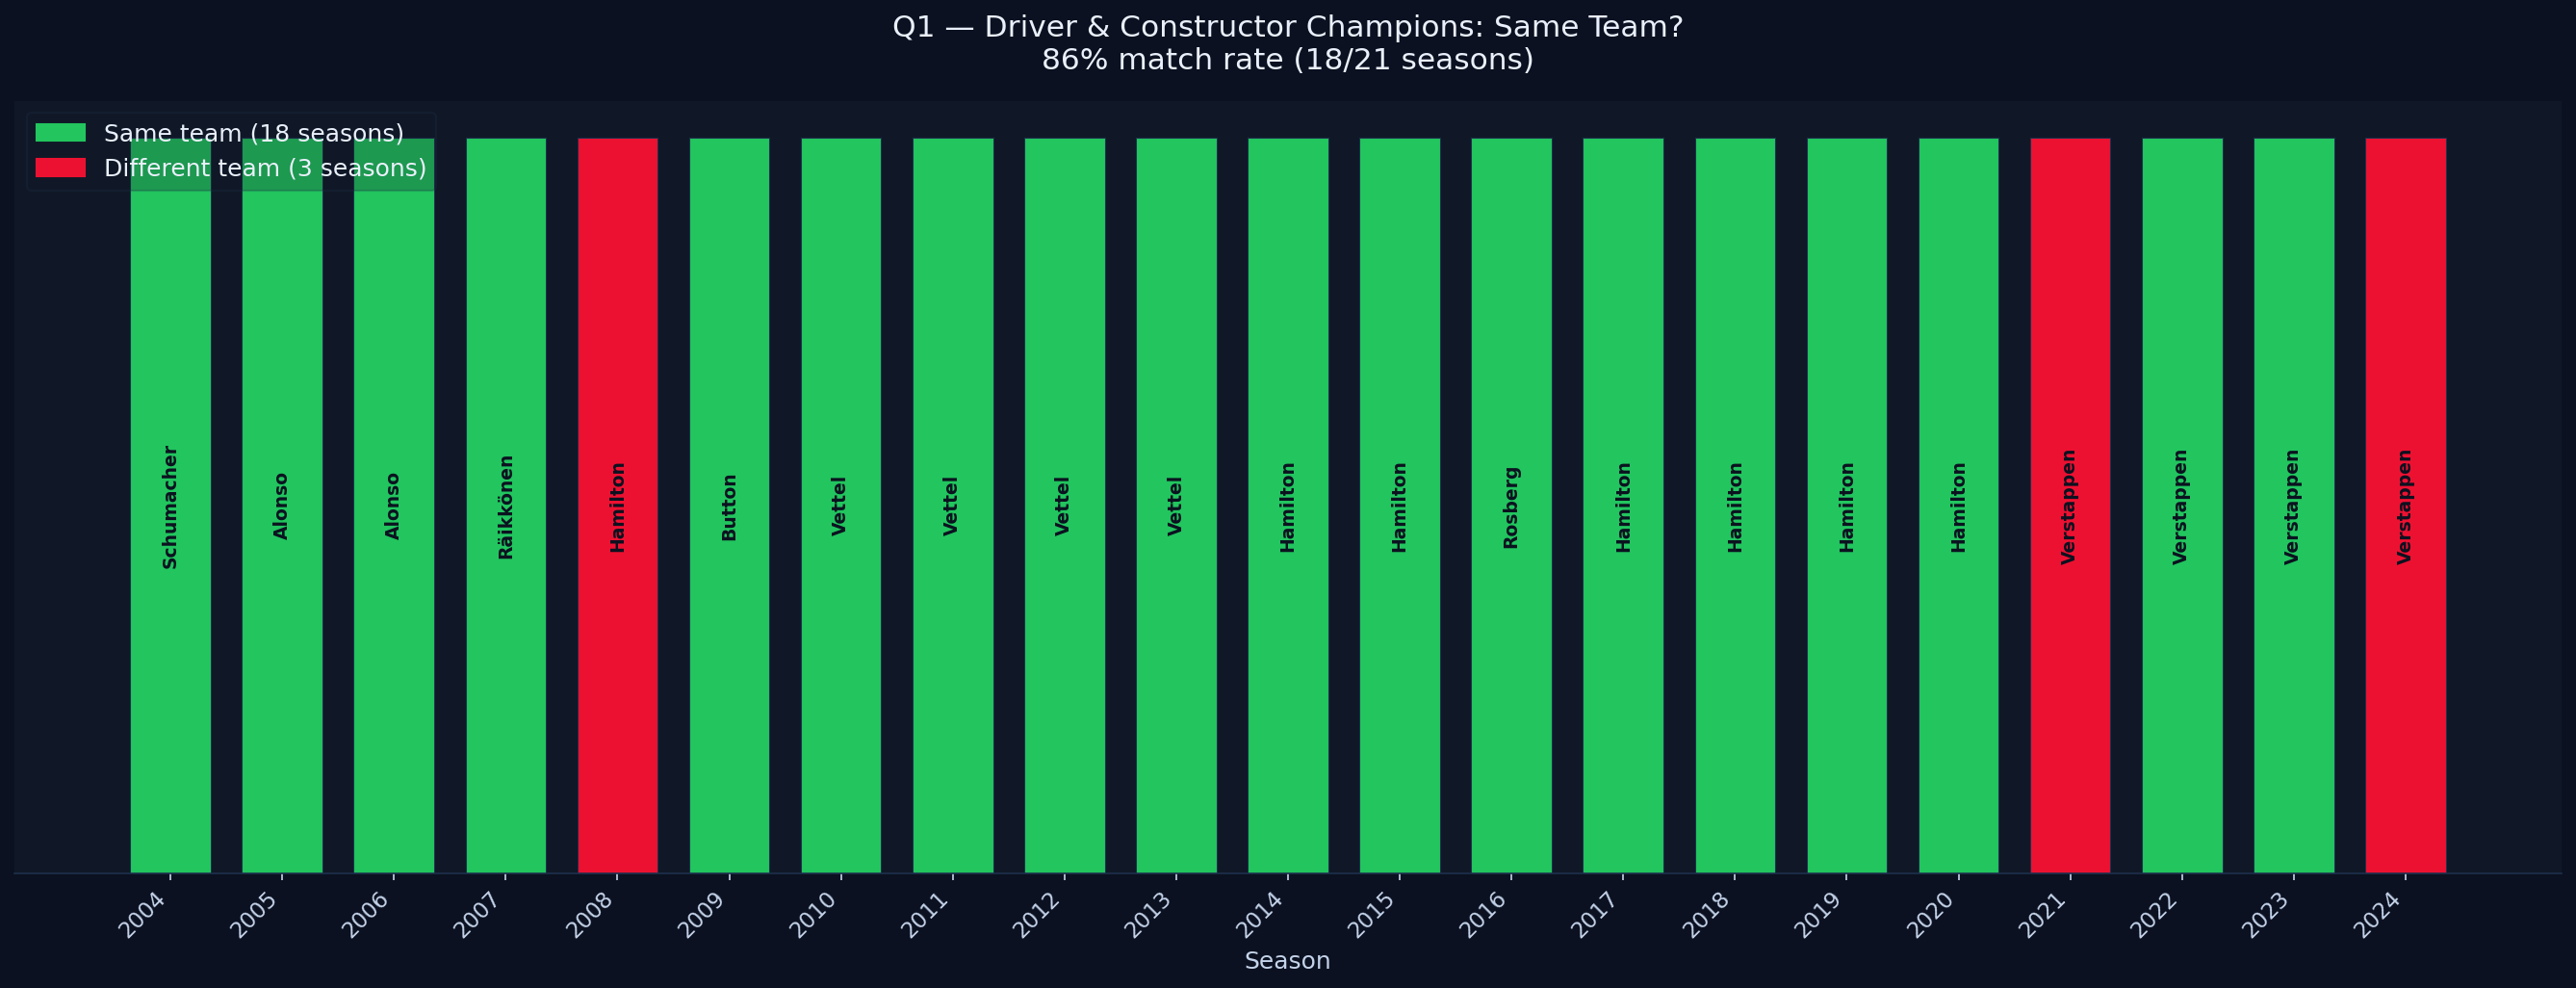
Comparing the constructor champion and driver champion team each season from 2004–2024. When they match, the car dominated. When they diverge, something extraordinary happened.
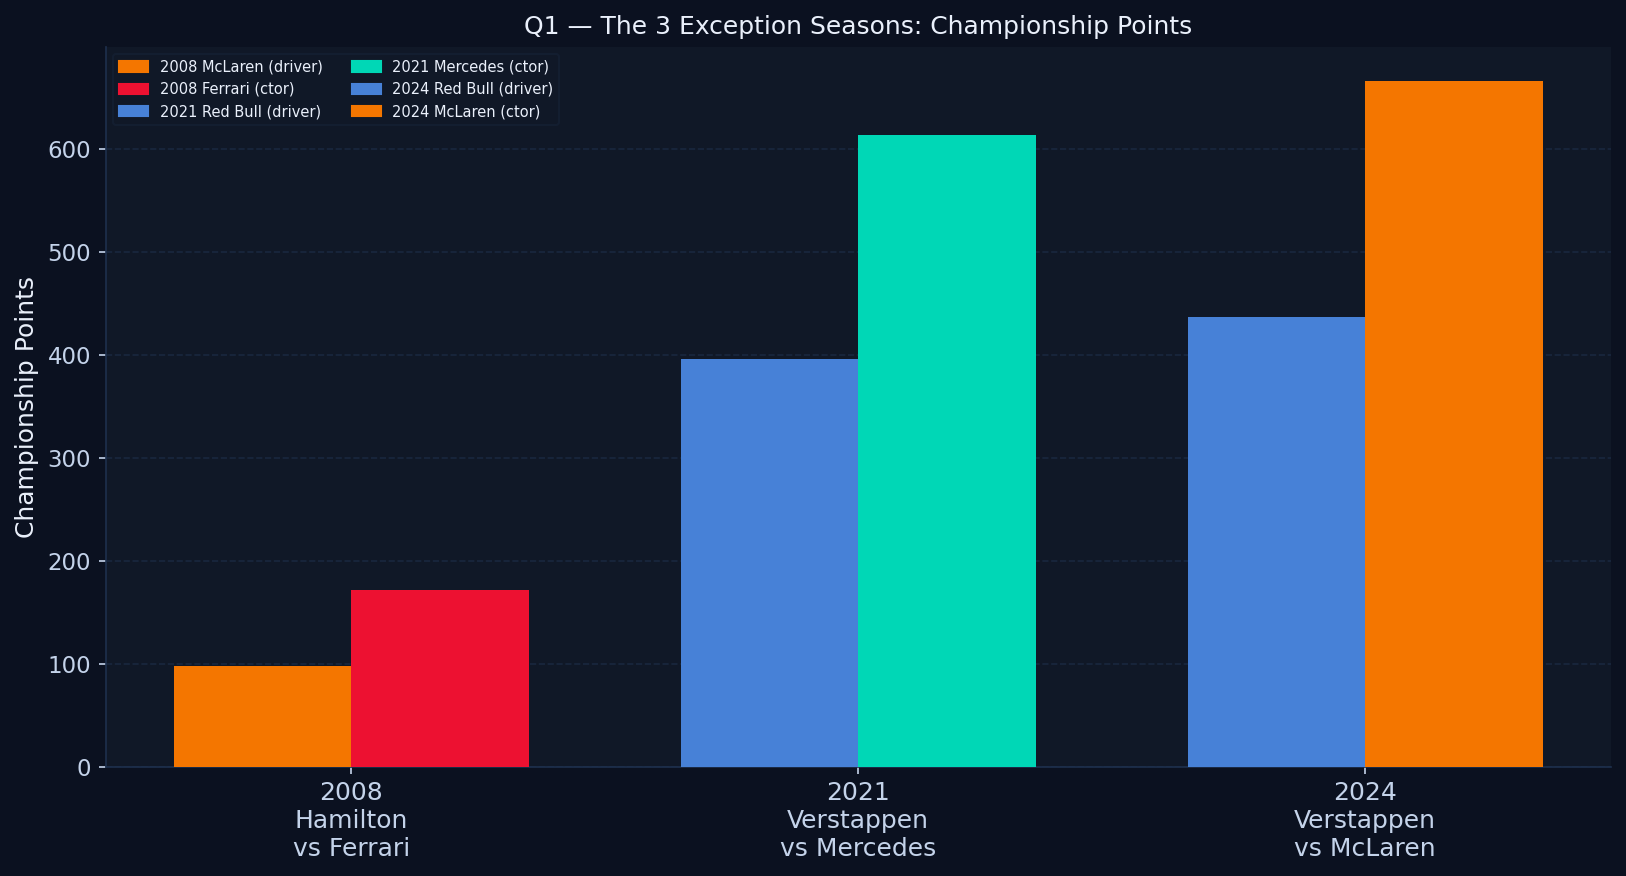
In 18 of 21 seasons, the drivers' champion and constructors' champion came from the same team, confirming that car performance is the dominant championship factor. The three exceptions are the most dramatic seasons in modern F1:
Takeaway: If you have the best car, you almost certainly win. The three exceptions are not statistical noise — they are the moments where driver brilliance and race-day execution overrode machinery.
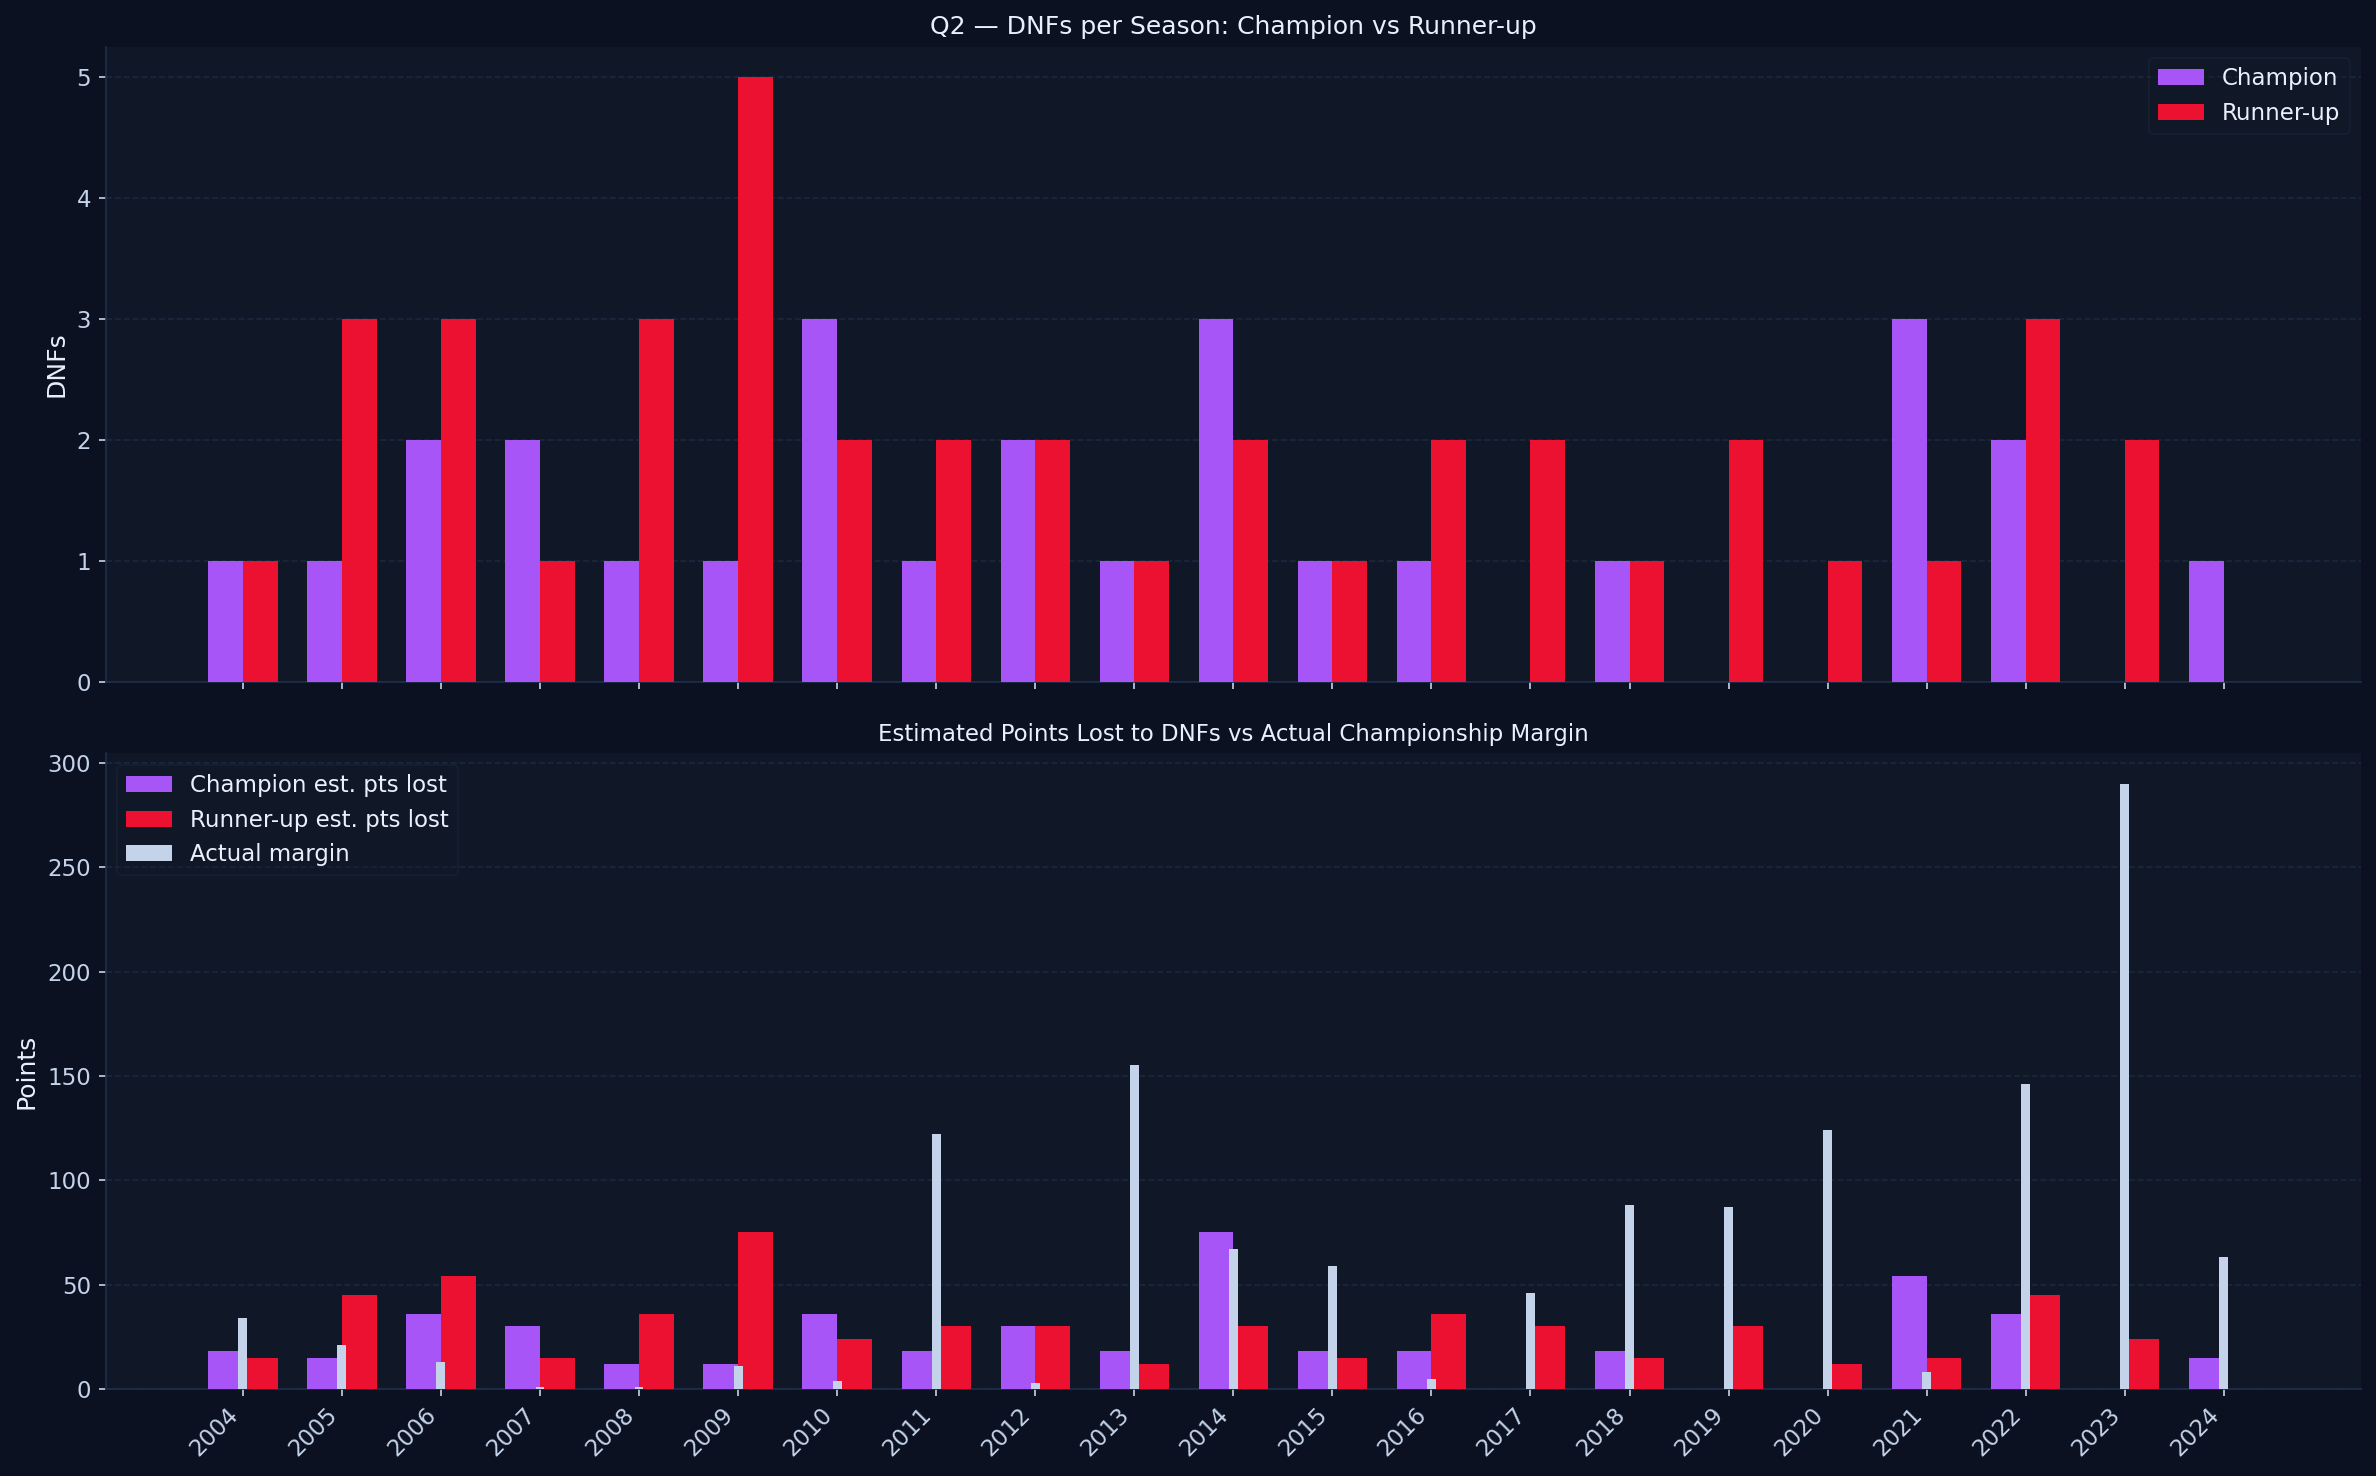
Analysing retirements per season for champions and runners-up, estimating points lost, and identifying seasons where reliability was the single decisive variable.
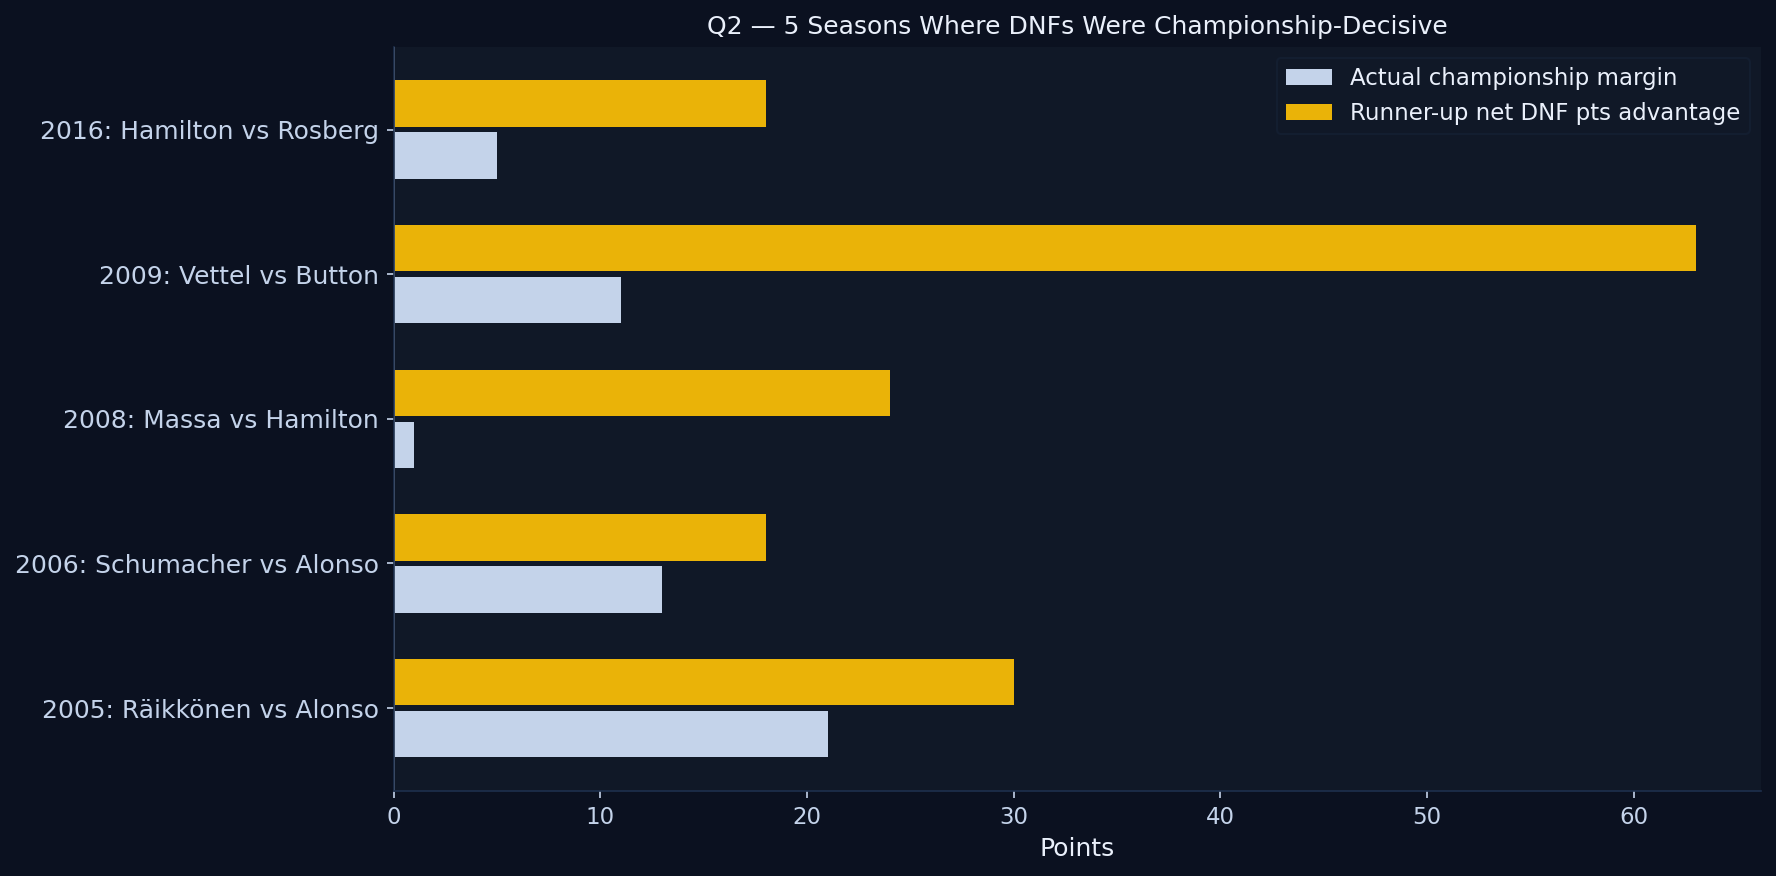
Using actual retirement data from status.csv and estimated points lost per DNF, the analysis flagged seasons where the runner-up's estimated lost points exceeded the final championship margin. The standout cases:
Takeaway: Reliability is a silent championship weapon. In close seasons, the driver who finishes more races wins.
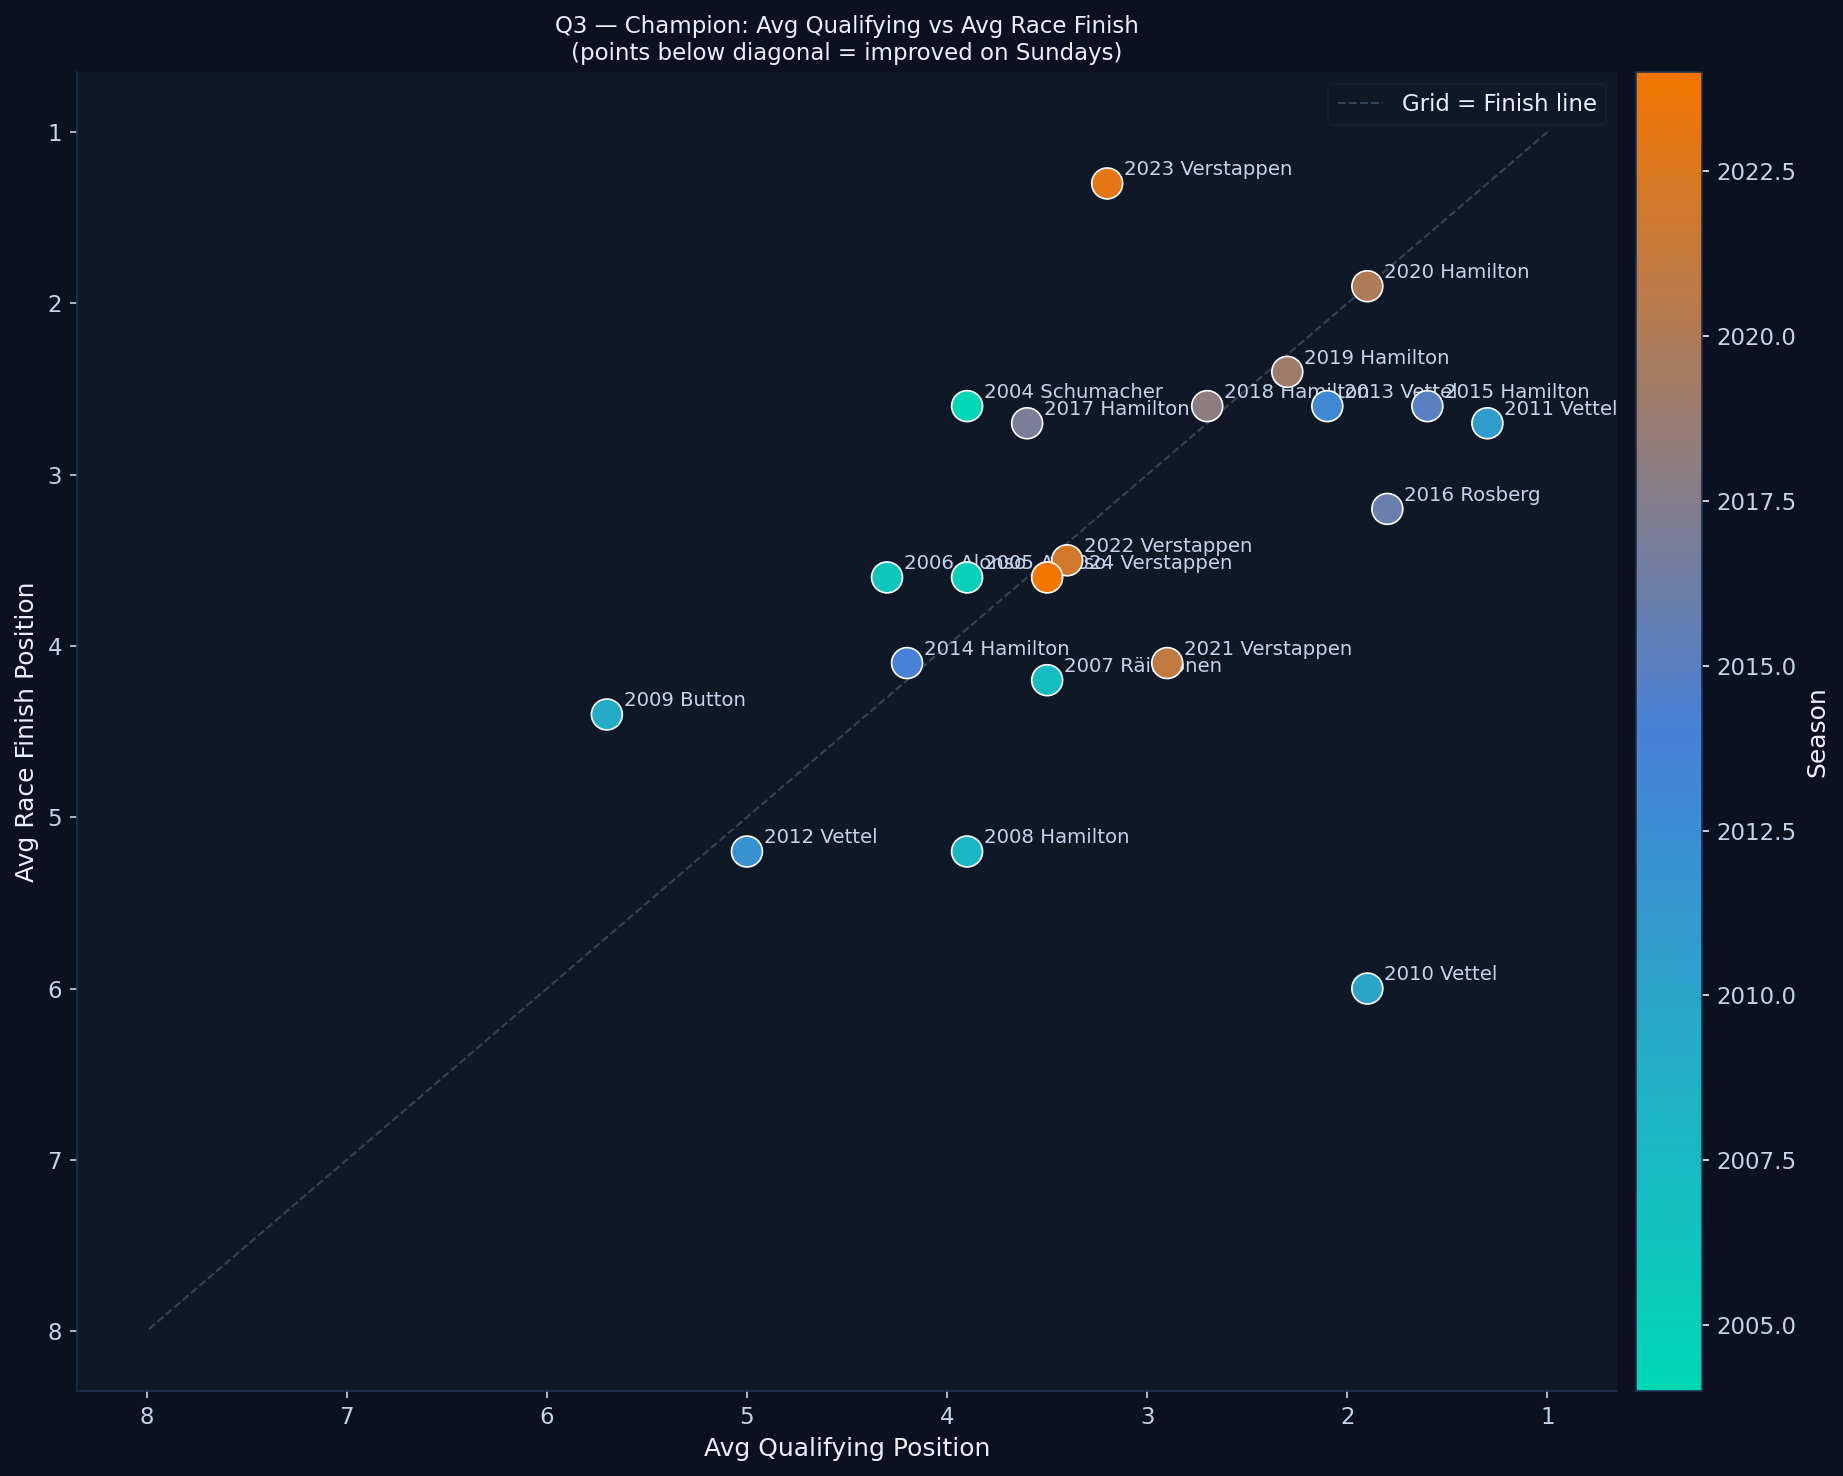
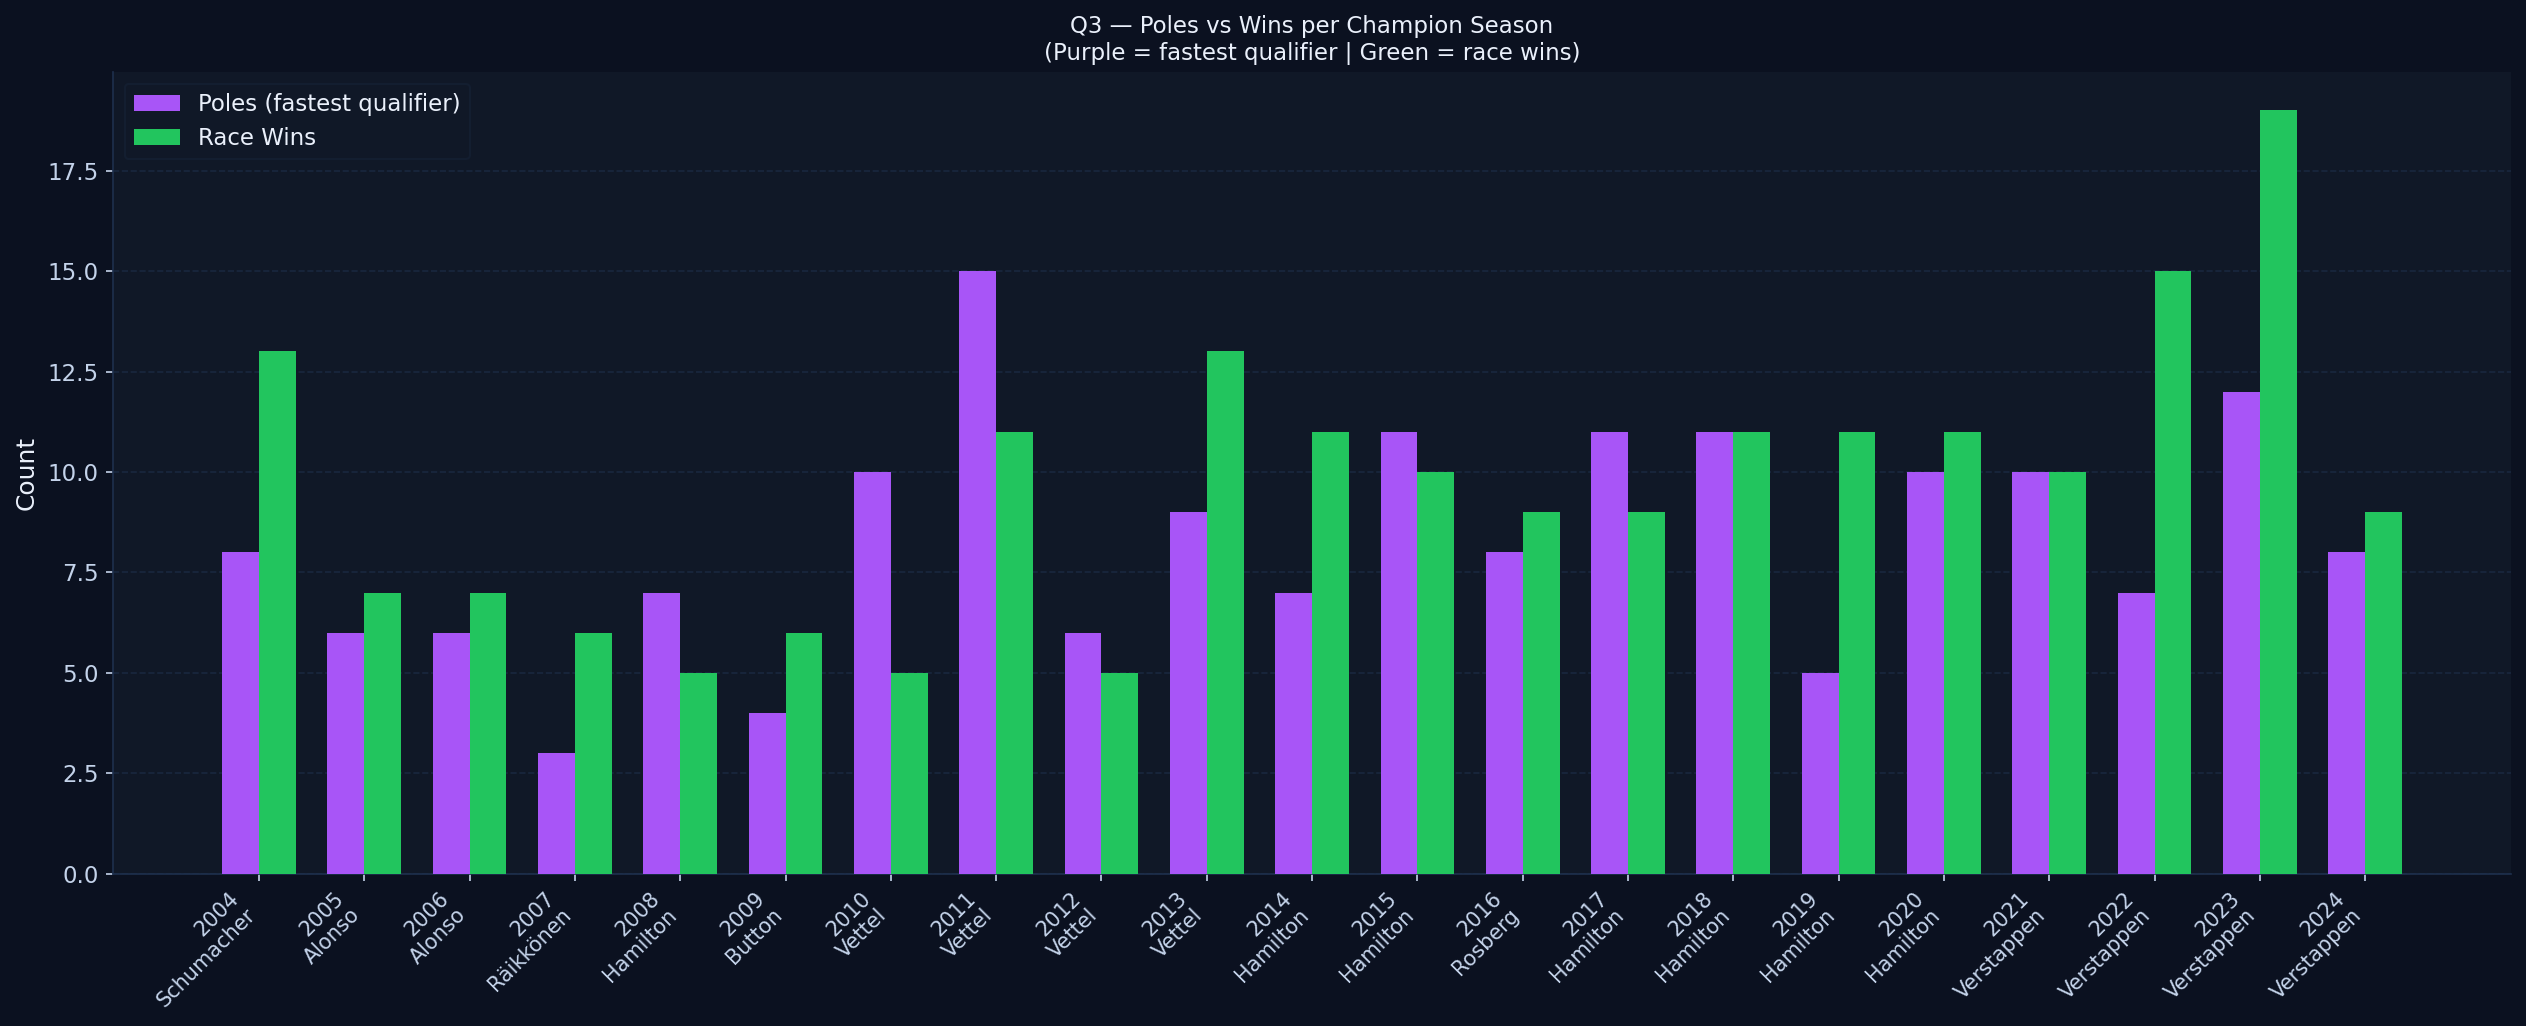
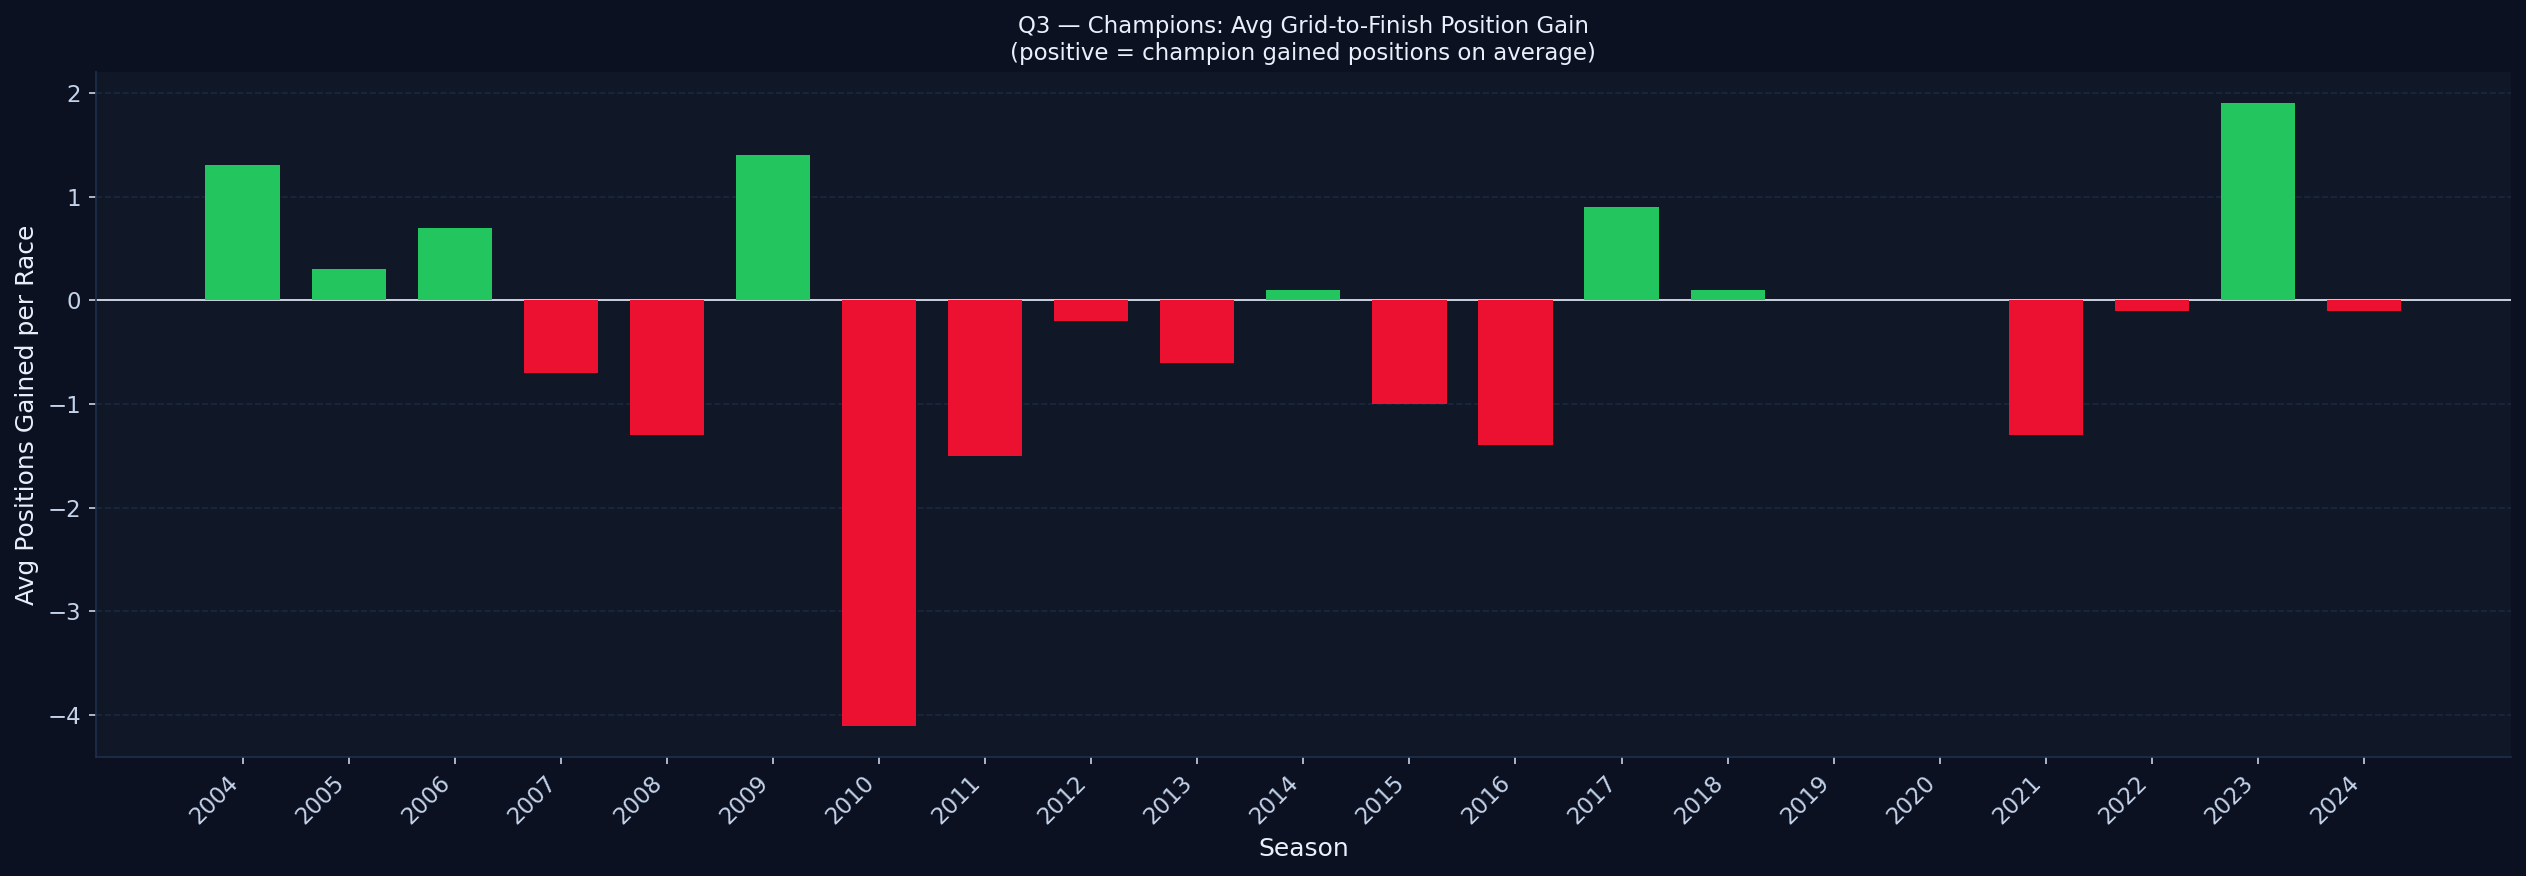
Comparing pole positions, wins, average grid position, and average race finish for every championship-winning season to identify whether Saturday or Sunday performance defines a title.
Champions averaged 8.3 poles but won significantly more races than their pole count alone would predict. Key examples:
Takeaway: Pole position helps but doesn't define champions. Converting race opportunities — especially from P3–P5 on the grid — is what separates title winners.
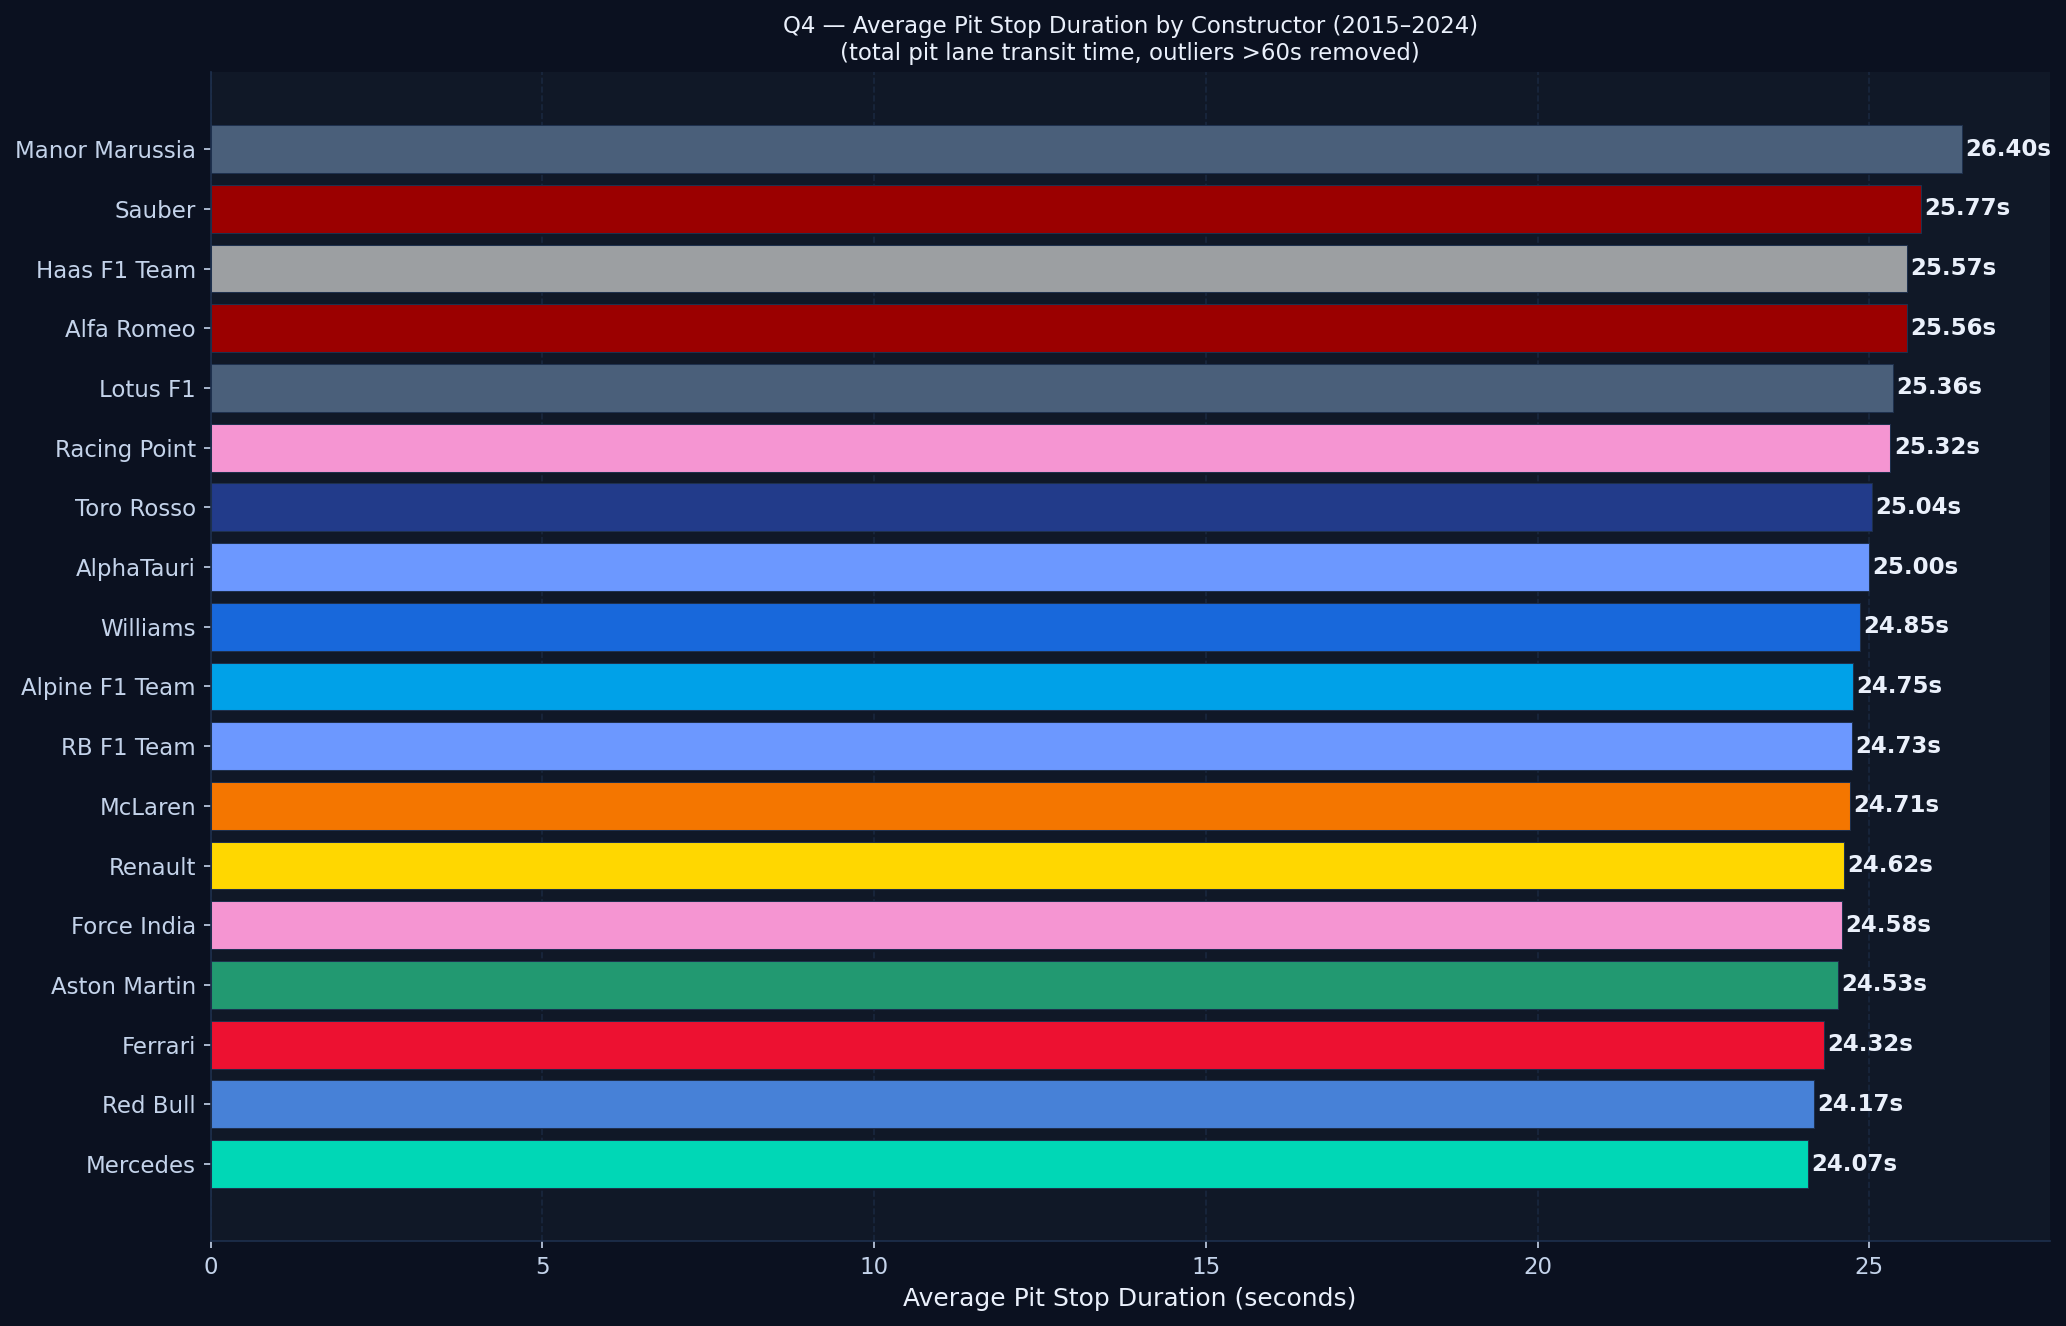
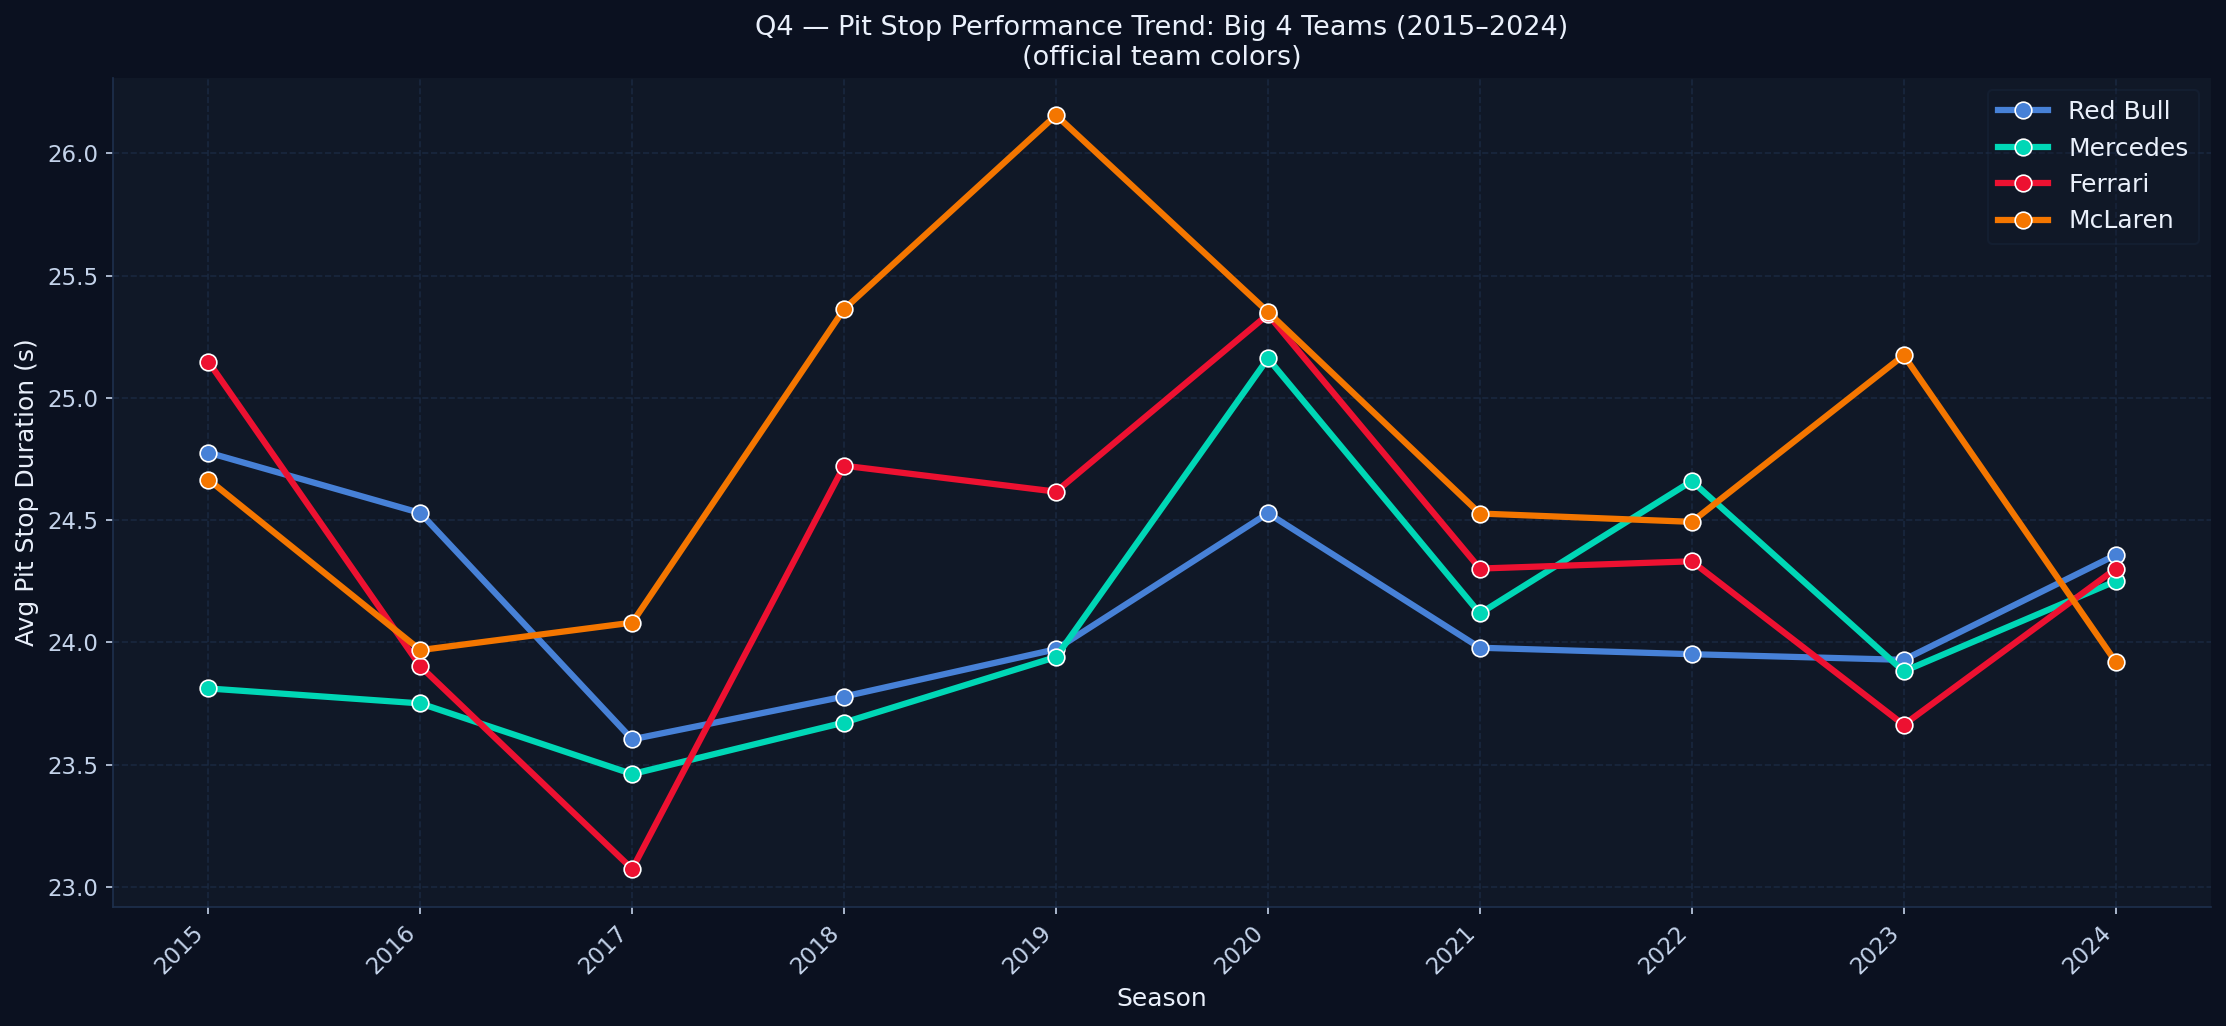
Analysing average pit stop durations by team across 2015–2024, removing outliers over 60 seconds, and tracking how the major constructors have evolved their crew performance across a decade.
The gap between the fastest and slowest top teams is approximately 2.2 seconds per stop. Across 22 races × 2 stops per race, that compounds to roughly 97 seconds of cumulative pit time advantage across the season.
Takeaway: Pit stop speed is not a substitute for car pace — it amplifies it. The best teams are fast everywhere.
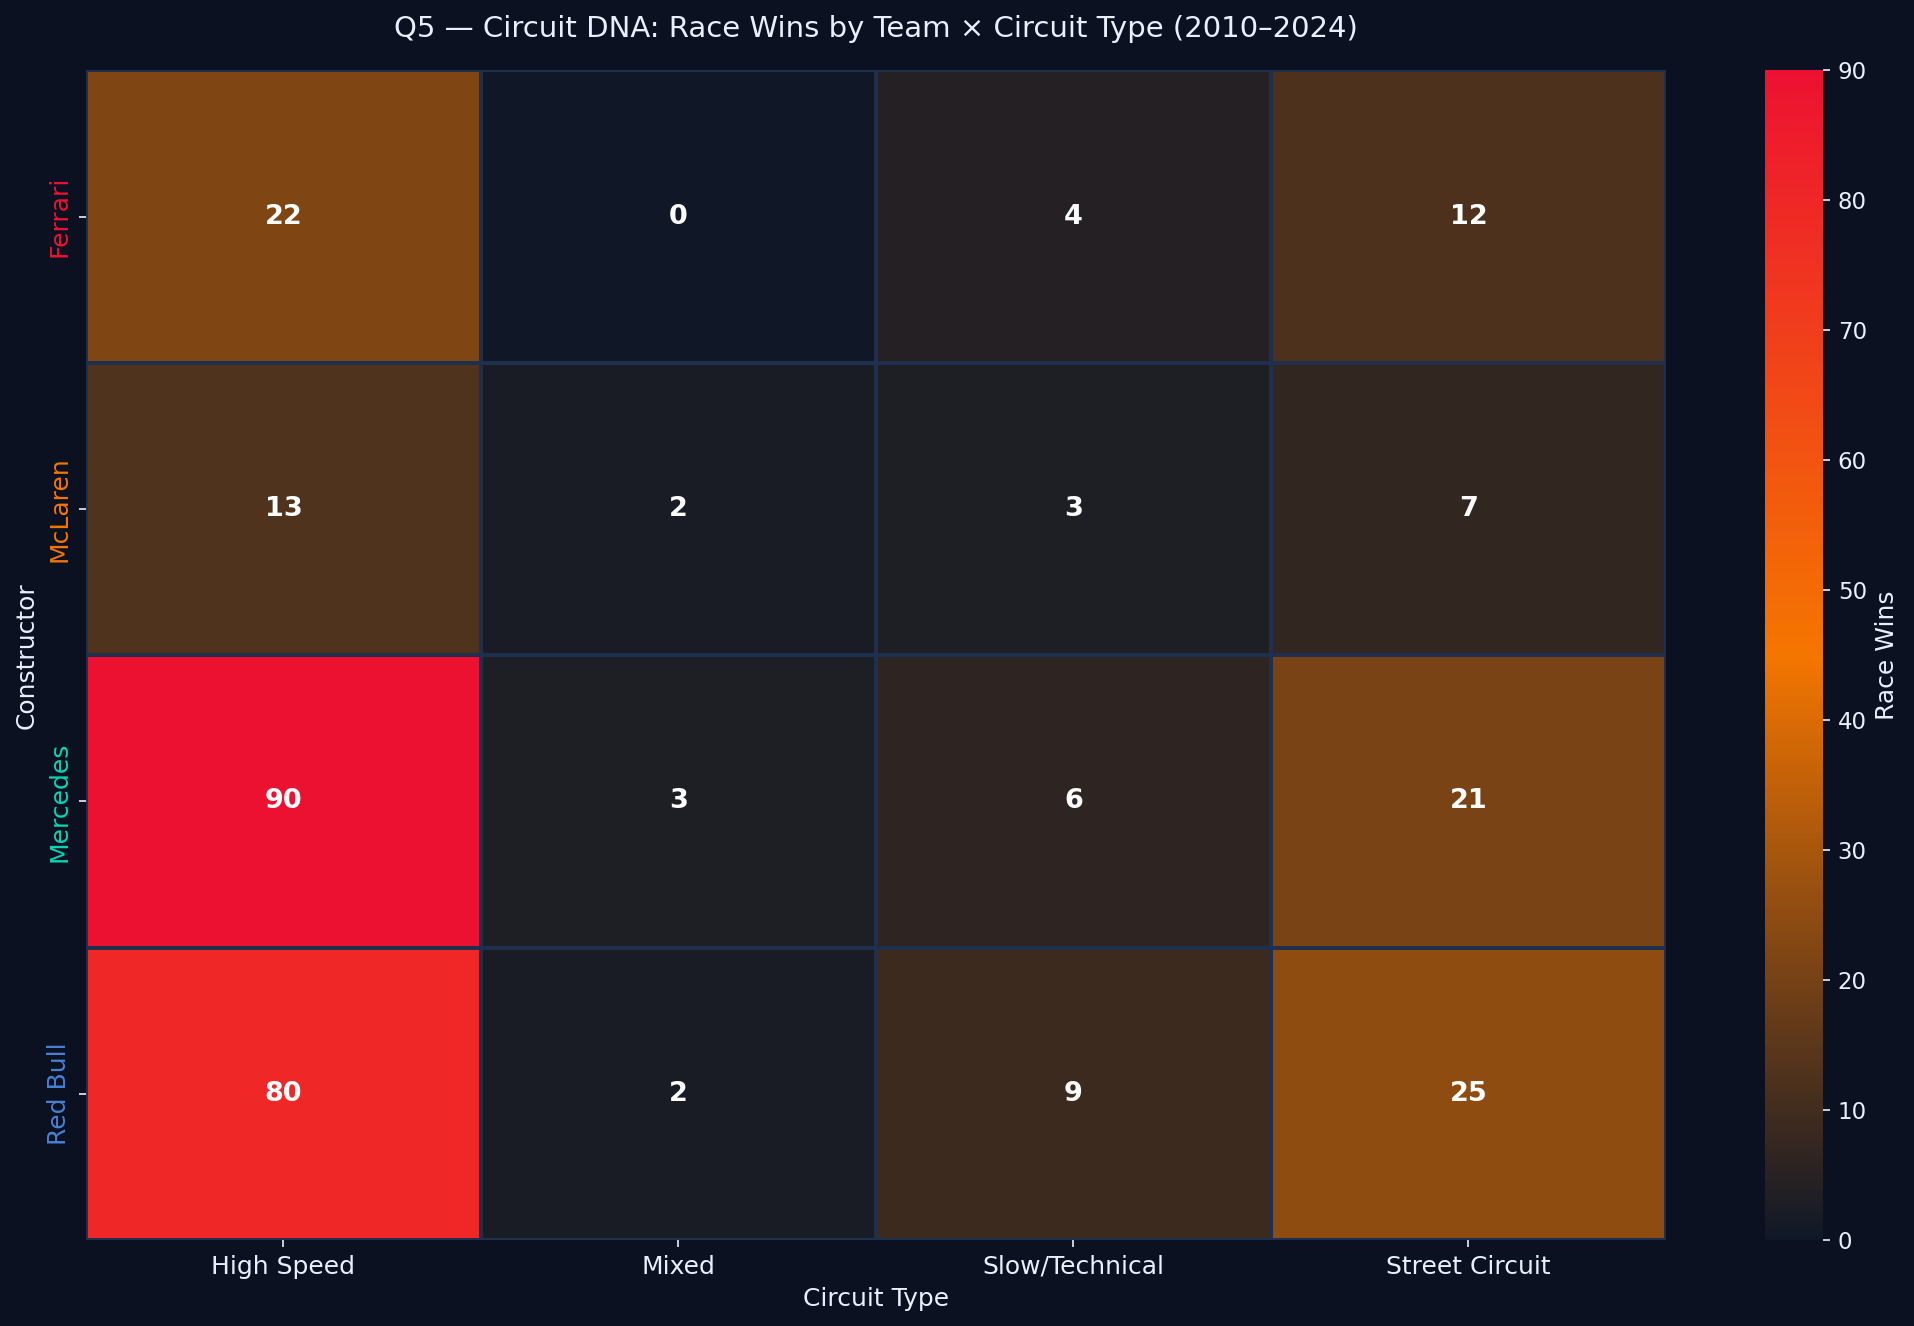
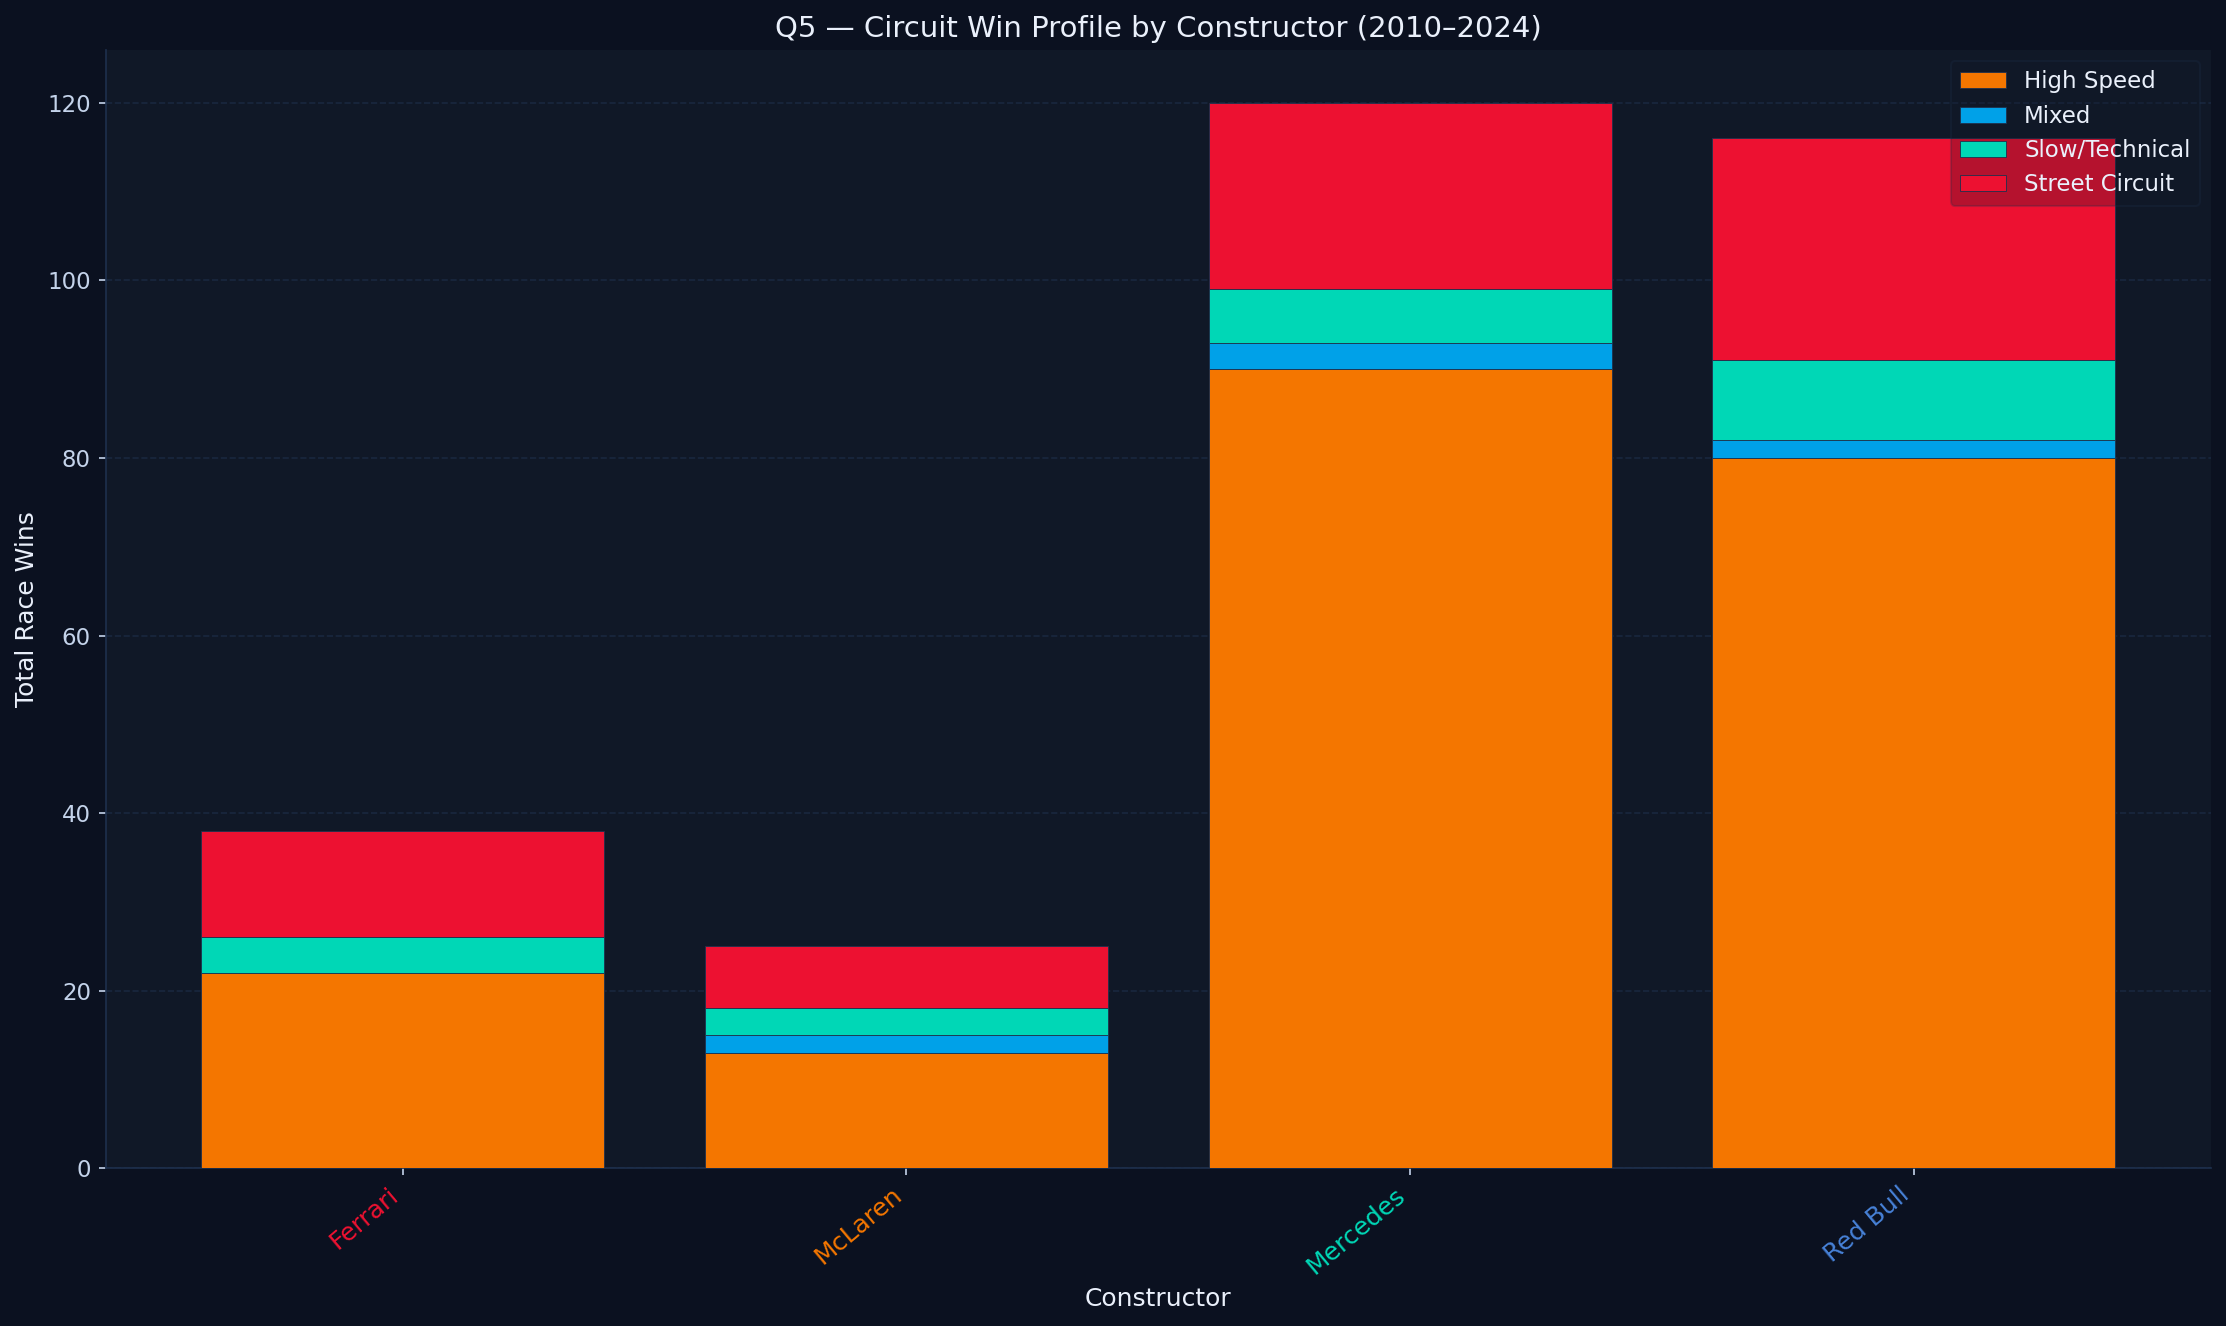
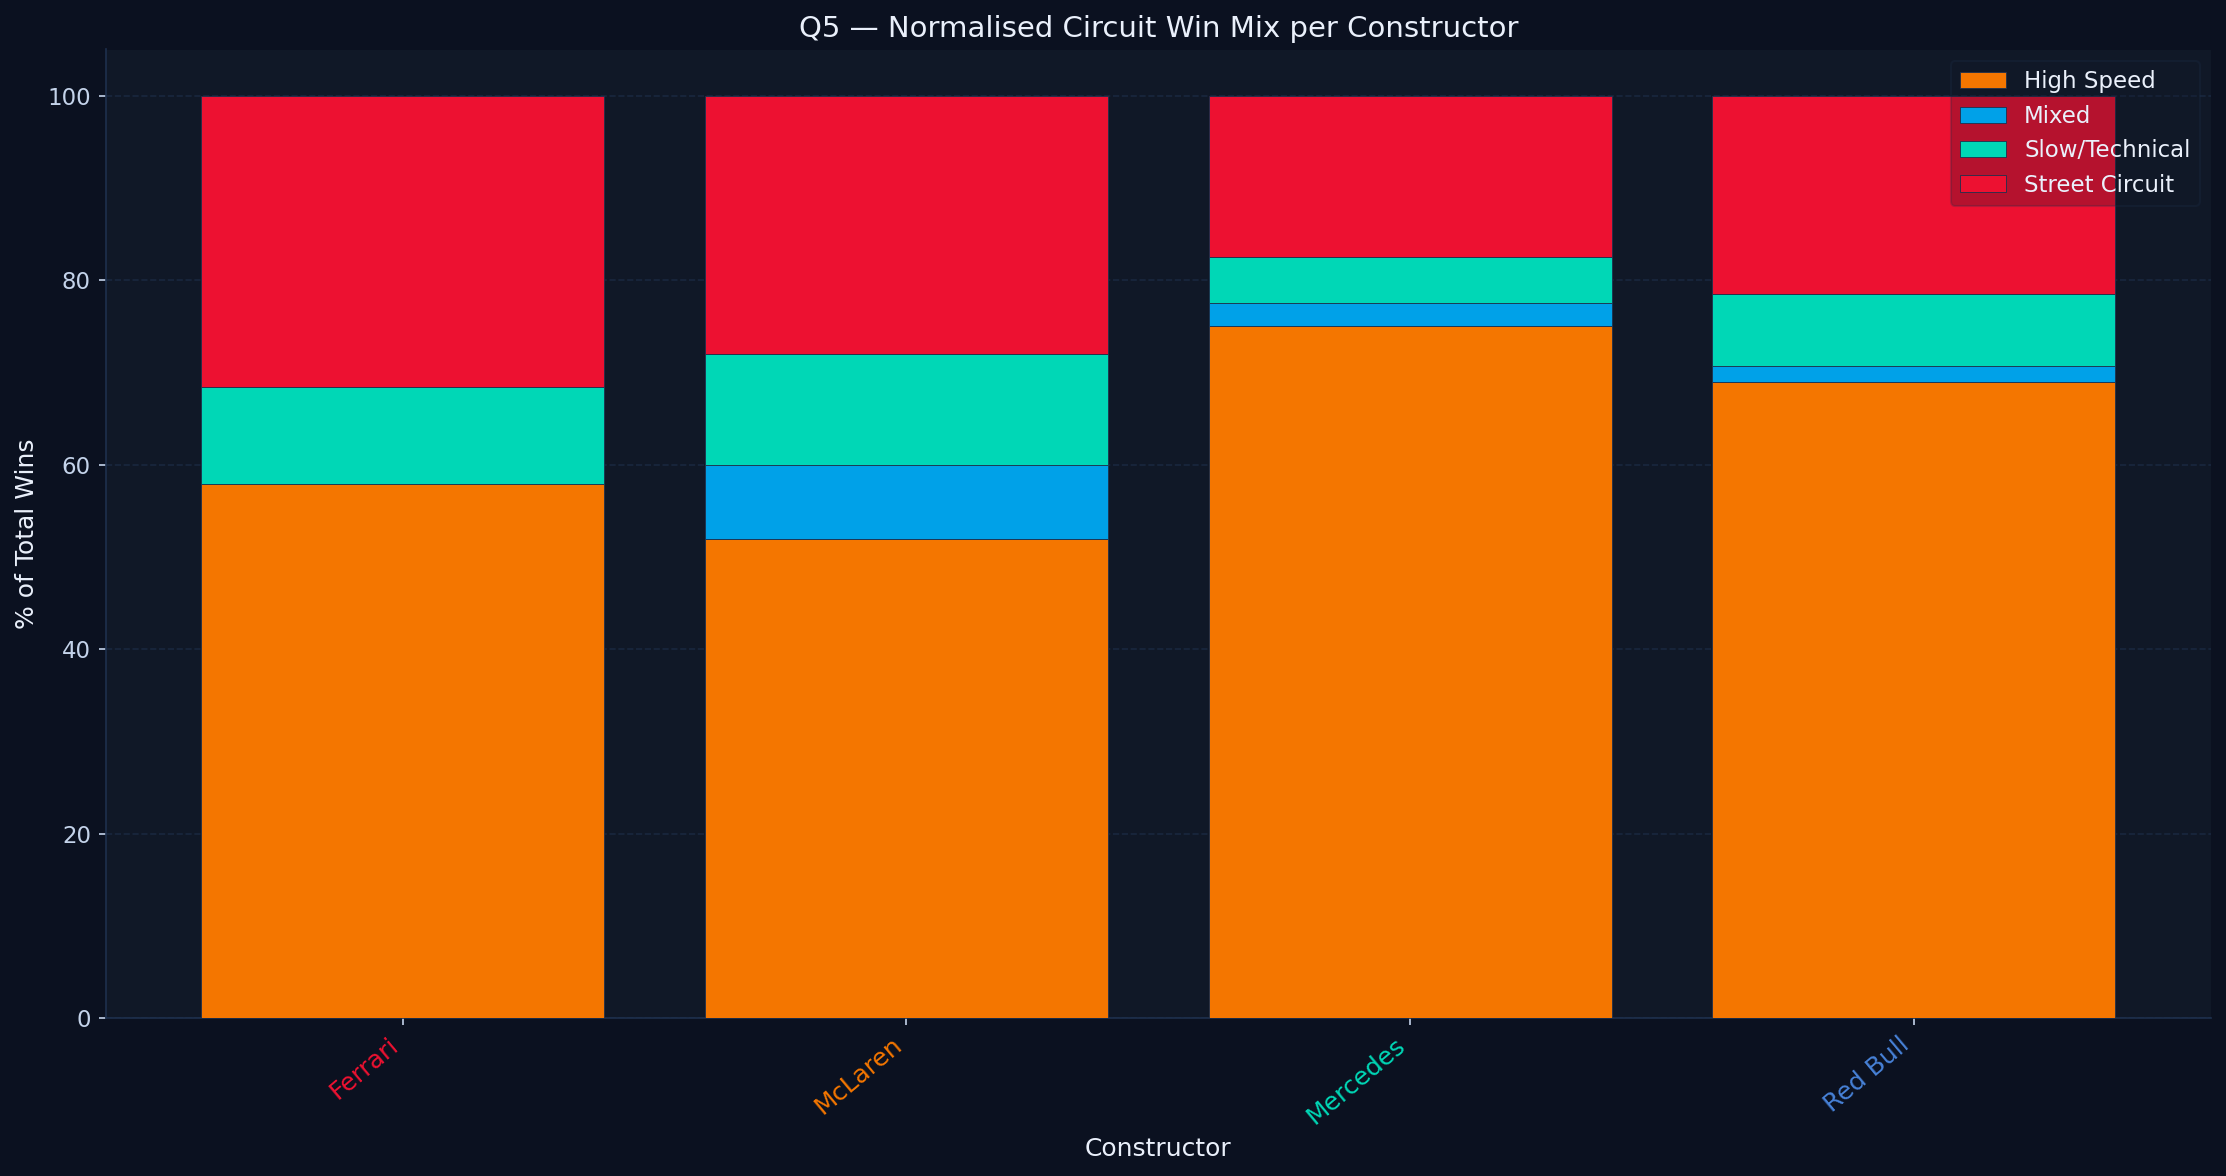
Classifying circuits into four archetypes — Street, High Speed, Slow/Technical, and Mixed — and mapping race wins by constructor to reveal each team's performance fingerprint.
Classifying 14 years of race results by circuit archetype reveals distinct performance fingerprints for each major constructor:
Takeaway: Circuit DNA is a sleeper factor in championship analysis. With 52% of races on mixed-character tracks, teams that can adapt their setup across archetypes — rather than optimise for one — consistently outscore specialist rivals over a full season.
| Archetype | Circuits | % of Calendar | Key Characteristic |
|---|---|---|---|
| 🏙️ Street | 5 | 22% | Temporary city roads, barriers, low grip, no run-off |
| 🚀 High-Speed | 4 | 17% | Long straights, high-speed corners, top-speed and aero efficiency critical |
| 🔀 Mixed | 12 | 52% | Blend of slow and fast sections — rewards all-round car balance |
| 🔧 Technical/Slow | 2 | 9% | Tight, low-speed layouts — mechanical grip and precision over raw pace |
All data sourced from the Ergast Motor Racing Database via Kaggle, covering 2004–2024 (21 seasons). Analysis built in Python using pandas, matplotlib, and seaborn. Excel workbook auto-generated with openpyxl.
| Question | Primary Dataset(s) | Metric Used | Known Limitation |
|---|---|---|---|
| Q1 — Car wins | driver_standings.csv · constructor_standings.csv | Final-race standings position by year | Does not capture mid-season car development trajectory |
| Q2 — DNF cost | results.csv · status.csv · driver_standings.csv | Estimated pts lost = avg finish position × points scale | DNFs often occur from strong grid positions — conservative estimate |
| Q3 — Quali vs race | qualifying.csv · results.csv | Grid pos, finish pos, positions gained per race | Qualifying data coverage is variable before 2010 |
| Q4 — Pit stops | pit_stops.csv | Avg total pit lane transit time (outliers >60s removed) | Pit stop data only available from 2011 onwards |
| Q5 — Circuit DNA | results.csv · circuits.csv · races.csv | Race wins by circuit type classification | Circuit classification uses heuristic rules — not official FIA categories |
Formula 1 championships are decided by a hierarchy of factors, not a single variable. Car performance is the dominant force — an 86% match rate between driver and constructor champions confirms that machinery governs the sport at the macro level. But reliability is the second pillar: champions averaged 1.3 DNFs per season versus 1.9 for runners-up, and in 5 of 21 seasons, that gap alone was large enough to be mathematically championship-decisive. Qualifying pace matters less than popular narrative suggests — champions like Hamilton in 2019 and Alonso in 2013 demonstrated that race execution can dramatically outperform what Saturday results predicted. Pit stop execution provides a compounding marginal advantage of approximately 97 seconds across a full season, which amplifies existing car pace rather than substituting for it. And circuit DNA reveals that no team wins everywhere equally — every car carries a performance fingerprint shaped by its mechanical and aerodynamic philosophy, making the calendar structure a silent championship variable. The clearest conclusion from 21 seasons of data: to win a Formula 1 World Championship, you need the fastest car, the fewest failures, and a driver who can extract more from the race than the car alone would suggest is possible.
Formula 1 uses a specific vocabulary that can be unfamiliar to new viewers. These definitions cover every term used in this analysis.
When a driver is forced to retire from a race before the end — due to a mechanical failure, crash, or other incident. A DNF scores zero points, regardless of how well the driver was running before the retirement. In a close championship, a single DNF can be the difference between winning and losing a title.
A constructor is a team that designs and builds its own racing car. In F1, each constructor enters two cars and two drivers per race. Teams compete in two separate championships: the World Drivers' Championship (WDC) for individual drivers, and the World Constructors' Championship (WCC) for the team. Examples: Ferrari, McLaren, Red Bull, Mercedes.
A pit stop is when a car enters the pit lane during a race for a tyre change and sometimes minor repairs. A typical stop lasts 2–3 seconds for the wheel change itself, but the full pit lane transit (entry, stop, exit) adds roughly 20–30 seconds. A fast pit crew can gain or lose positions relative to rivals who stop at the same time.
The driver who sets the fastest time in qualifying earns pole position — they start the race from the very front of the grid. Starting from pole is a significant advantage, as it avoids traffic and allows the driver to control their own pace from lap one. Since 2021, pole position also awards 1 bonus championship point.
Qualifying takes place on Saturday and determines the starting order (grid) for Sunday's race. In the modern format (Q1/Q2/Q3), the slowest drivers are eliminated in each segment until the top 10 shootout. The driver who sets the fastest overall lap time takes pole position. Qualifying pace ≠ race pace — a fast Saturday does not guarantee a strong Sunday finish.
When there is a crash or dangerous debris on track, the Safety Car — a road car driven by a professional — leads the field at reduced speed while marshals clear the circuit. All cars must line up behind the Safety Car and cannot overtake. Safety Car periods often trigger strategic pit stop windows, as teams can change tyres with minimal time loss. The controversial 2021 Abu Dhabi finale involved a disputed Safety Car restart procedure that handed Verstappen the title over Hamilton.
F1 awards two world titles every season. The WDC (World Drivers' Championship) goes to the individual driver with the most points. The WCC (World Constructors' Championship) goes to the team whose two cars collectively score the most points. A team can win one without the other — as happened in 2008, 2021, and 2024.
An undercut is when a driver pits before a rival, takes on fresh tyres, and uses the resulting pace advantage to emerge ahead in traffic. An overcut is the reverse — staying out longer on worn tyres while the rival pits, hoping track position and tyre temperature hold long enough to stay ahead. Both are core strategic weapons used by teams to gain positions without on-track overtaking.
Points are awarded to the top 10 finishers in each race: 1st = 25 pts, 2nd = 18, 3rd = 15, 4th = 12, 5th = 10, 6th = 8, 7th = 6, 8th = 4, 9th = 2, 10th = 1. An additional 1 point is awarded for the fastest lap (if the driver finishes in the top 10). A DNF scores 0. Points accumulate across all races to determine the final championship standings.
The grid is the starting formation for the race, arranged in two columns on the start/finish straight. Positions on the grid are determined by qualifying results. Starting further back means fighting through traffic, increasing the risk of early incidents and making tyre strategy more complicated. Average grid position is used in this analysis as a proxy for a driver's qualifying pace across a full championship season.
A lap time is the duration it takes a car to complete one full circuit of the track. In F1 broadcast timing, laps are color-coded: purple = overall fastest lap of the session, green = the driver's own personal best lap, yellow = no improvement on previous lap. This color language is used throughout this analysis.
For Q5, circuits are grouped into four categories based on the 2026 active calendar: Street — temporary city roads with barriers and low grip (Monaco, Singapore, Baku, Las Vegas, Jeddah); High-Speed — tracks with long fast corners where top speed and aero efficiency dominate (Spa, Silverstone, Monza, Red Bull Ring); Technical/Slow — tight, low-speed layouts where mechanical grip and precision matter most (Hungaroring, Zandvoort); Mixed — tracks with a blend of fast and slow sections that reward all-round balance (12 circuits, 52% of the calendar).